WeBIPP Tutorial - Dotchart
Video Tutorial (Coming Soon)
- Download the data in JSON form: link
- Read in the data (Tutorial - Reading Data from JSON)
- Drop a Cartesian Frame into the Graphics Region
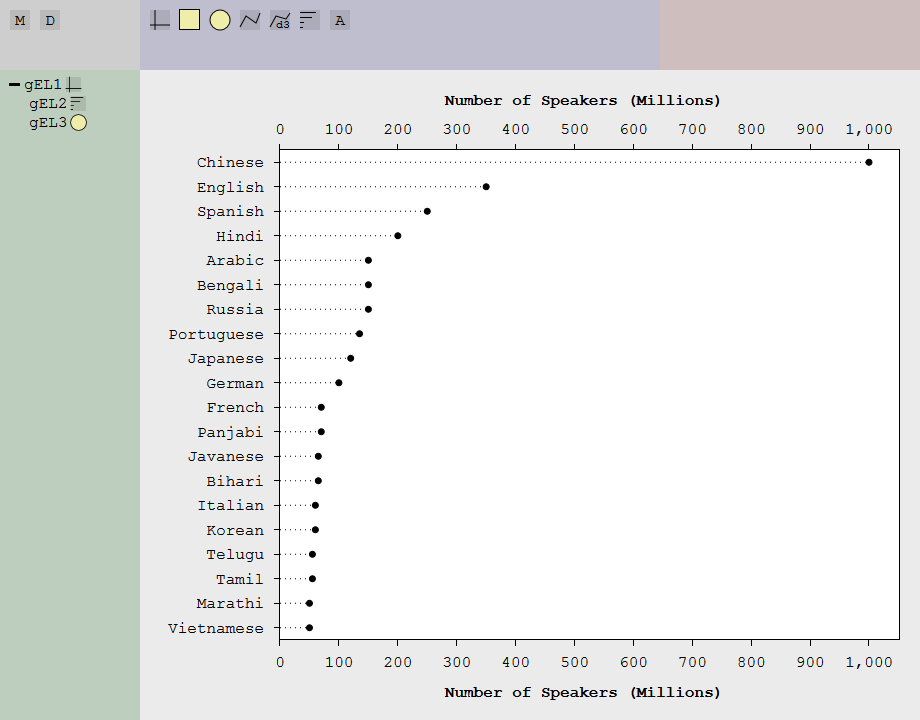
- Select the Cartesian Frame and assign the data speakers to x, and lang to y
- Set x-domain to
[0,1000]and x-range to[0,0.95], so that the graph now starts at 0, giving the lines in the dotchart meaning (encodes the data values) - Set transform to
[140,80]to display the y axis labels - Drop a Line Segment onto the Cartesian Frame
- Select the Line Segment and assign 0 to x1, speakers to x2, and lang to both y1 and y2
- Also set stroke-dasharray to
1 4to make it a dotted line (1 pixel drawn, then 4 pixels of nothing drawn, recurring) - Drop a Circle onto the Cartesian Frame
- Select the Circle and assign speakers to cx, and lang to cy
- Select the Cartesian Frame, and assign Number of Speakers (Millions) to x-name and assign a blank y-name
- Set y-range to
[0, 1]to make full use of the vertical space - Set axes to
[1,2,3]to display axis labels on the bottom (1), left (2) and top (3) - Select the Circle, and set fill to black and r to 3
The following assume you have finished the integrated tutorial
Draw the lines and dots
Polishing Steps
Your final code should look something like this
wbip.data["datMotherTongue.json"] = JSON.parse("{\"lang\":[\"Chinese\",\"English\",\"Spanish\",\"Hindi\",\"Arabic\",\"Bengali\",\"Russia\",\"Portuguese\",\"Japanese\",\"German\",\"French\",\"Panjabi\",\"Javanese\",\"Bihari\",\"Italian\",\"Korean\",\"Telugu\",\"Tamil\",\"Marathi\",\"Vietnamese\"],\"speakers\":[1000,350,250,200,150,150,150,135,120,100,70,70,65,65,60,60,55,55,50,50]}\r\n");
wbip["frcart"].click("gEL1", d3.select("#gGraph"), [89,86]);
wbip["frcart"].setattr("gEL1", "x", "wbip.data[\"datMotherTongue.json\"][\"speakers\"]");
wbip["frcart"].setattr("gEL1", "y", "wbip.data[\"datMotherTongue.json\"][\"lang\"]");
wbip["frcart"].setattr("gEL1", "x-domain", "[0,1000]");
wbip["frcart"].setattr("gEL1", "x-range", "[0,0.95]");
wbip["frcart"].setattr("gEL1", "transform", "[140,80]");
wbip["line-segment"].click("gEL2", d3.select("#gEL1"), [57,57]);
wbip["line-segment"].setattr("gEL2", "x1", "0");
wbip["line-segment"].setattr("gEL2", "x2", "wbip.data[\"datMotherTongue.json\"][\"speakers\"]");
wbip["line-segment"].setattr("gEL2", "y1", "wbip.data[\"datMotherTongue.json\"][\"lang\"]");
wbip["line-segment"].setattr("gEL2", "y2", "wbip.data[\"datMotherTongue.json\"][\"lang\"]");
wbip["line-segment"].setattr("gEL2", "stroke-dasharray", "1 4");
wbip["circle"].click("gEL3", d3.select("#gEL1"), [224,167]);
wbip["circle"].setattr("gEL3", "cx", "wbip.data[\"datMotherTongue.json\"][\"speakers\"]");
wbip["circle"].setattr("gEL3", "cy", "wbip.data[\"datMotherTongue.json\"][\"lang\"]");
wbip["frcart"].setattr("gEL1", "x-name", "Number of Speakers (Millions)");
wbip["frcart"].setattr("gEL1", "y-name", "");
wbip["frcart"].setattr("gEL1", "y-range", "[0, 1]");
wbip["frcart"].setattr("gEL1", "axes", "[1,2,3]");
wbip["circle"].setattr("gEL3", "fill", "black");
wbip["circle"].setattr("gEL3", "r", "3");