WeBIPP Tutorial - Scatterplot
Video Tutorial (Coming Soon)
- Download the data in JSON form: link
- Read in the data (Tutorial - Reading Data from JSON)
- Drop a Cartesian Frame into the Graphics Region
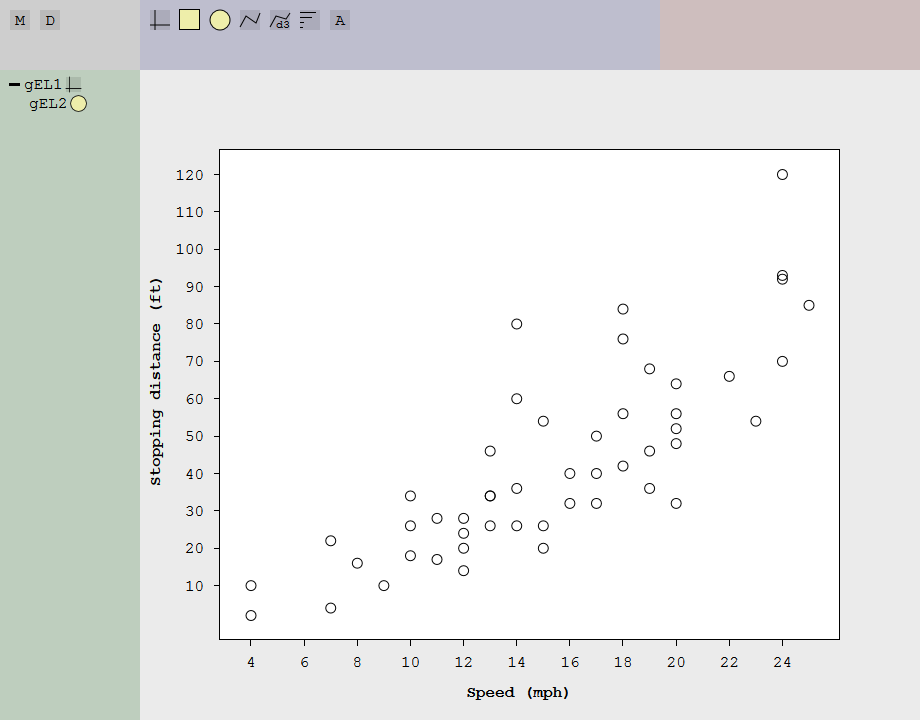
- Select the Cartesian Frame and assign the data speed to x, and dist to y
- Drop a Circle onto the Cartesian Frame
- Select the Circle and assign speed to cx, and dist to cy
- Select the Cartesian Frame, and assign Speed (mph) to x-name and Stopping distance (ft) to y-name
- Select the Circle, and set fill to none and r to 5
The following assume you have finished the integrated tutorial
Polishing Steps
Your final code should look something like this
wbip.data["datCars.json"] = JSON.parse("{\"speed\":[4,4,7,7,8,9,10,10,10,11,11,12,12,12,12,13,13,13,13,14,14,14,14,15,15,15,16,16,17,17,17,18,18,18,18,19,19,19,20,20,20,20,20,22,23,24,24,24,24,25],\"dist\":[2,10,4,22,16,10,18,26,34,17,28,14,20,24,28,26,34,34,46,26,36,60,80,20,26,54,32,40,32,40,50,42,56,76,84,36,46,68,32,48,52,56,64,66,54,70,92,93,120,85]}\r\n");
wbip["frcart"].click("gEL1", d3.select("#gGraph"), [43,42]);
wbip["frcart"].setattr("gEL1", "x", "wbip.data[\"datCars.json\"][\"speed\"]");
wbip["frcart"].setattr("gEL1", "y", "wbip.data[\"datCars.json\"][\"dist\"]");
wbip["circle"].click("gEL2", d3.select("#gEL1"), [91,206]);
wbip["circle"].setattr("gEL2", "cx", "wbip.data[\"datCars.json\"][\"speed\"]");
wbip["circle"].setattr("gEL2", "cy", "wbip.data[\"datCars.json\"][\"dist\"]");
wbip["frcart"].setattr("gEL1", "x-name", "Speed (mph)");
wbip["frcart"].setattr("gEL1", "y-name", "Stopping distance (ft)");
wbip["circle"].setattr("gEL2", "fill", "none");
wbip["circle"].setattr("gEL2", "r", "5");