OVERVIEW USE VIT
Jump to: Data mode - -
Switching to Analysis mode - -
Analysis mode - -
Controlling the display - -
File Menu - -
Top
A set of instructions for starting VIT and using it for a simple example are here

Jump to: Data mode - -
Switching to Analysis mode - -
Analysis mode - -
Controlling the display - -
File Menu - -
Top
DATA mode
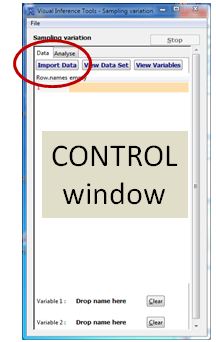
The VIT modules open to a control window with the “Data” tab selected. Get started by loading some data.
Jump to: Data mode - - Switching to Analysis mode - - Analysis mode - - Controlling the display - - File Menu - - Top
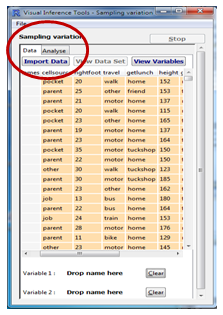
 Click on Import Data and follow the data import dialogue to import your data. It will appear in the data view when it is loaded. |
 Drag the names of one or two variables from the top of the spread sheet onto the drop boxes at the bottom of the command screen |
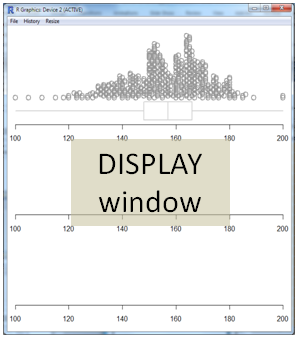
 A plotting window will appear with a plot appropriate to the selected variable(s) | ||
 |
 |
 |
Jump to: Data mode - - Switching to Analysis mode - - Analysis mode - - Controlling the display - - File Menu - - Top
Switch to Analysis mode
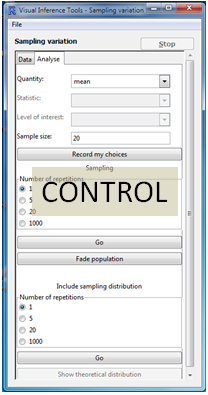
The VIT modules open to a control window with the “Data” tab selected. Get started by loading some data.After loading your data click on the Analyse tab |
The Data Analysis Control Panel will appear |
As parameters are selected on the control panel, the results will show in the corresponding graphics window panel |
 |
 |
|
Jump to: Data mode - - Switching to Analysis mode - - Analysis mode - - Controlling the display - - File Menu - - Top
ANALYSIS mode
ANIMATIONS To initiate Panel 2 and Panel 3 animations, select a radio button for 1, 50, 20 or 1000 repetitions and press Go
Jump to: Data mode - - Switching to Analysis mode - - Analysis mode - - Controlling the display - - File Menu - - Top
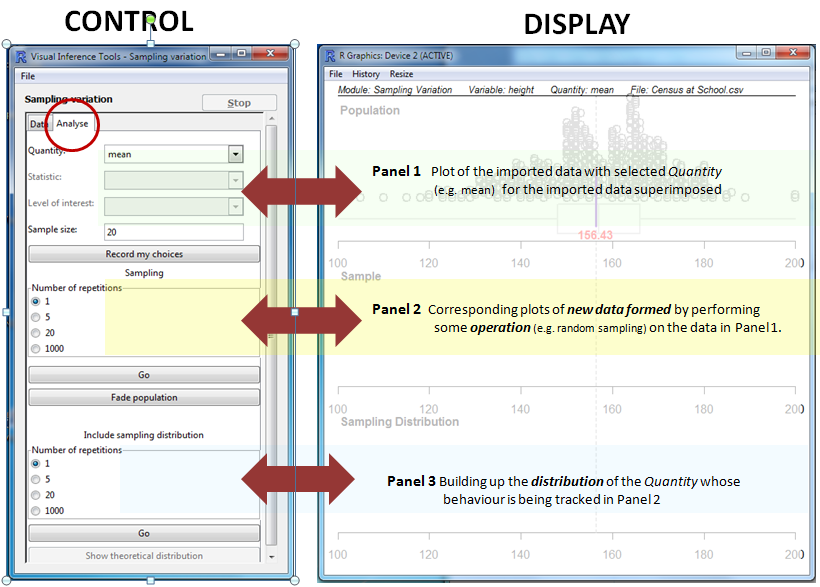
Controlling the Display
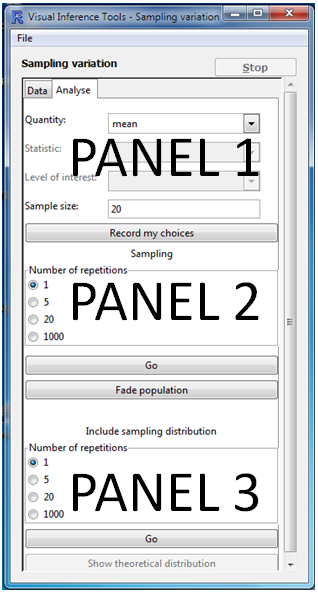
PANEL 1
Choose your parameters then click "Record my choices". This records the Quantity (e.g. Mean)whose behaviour is to be investigatedPANEL 2
Explore the effect of the operation (e.g. random sampling) on data plots, tracking the behaviour of Quantity over repetitionsPANEL 3
Represents the behaviour of the selected Quantity as a distributionChoosing the number of repetitions
| Panel 2 | 1 or 5 repetitions emphasise the nature of operation 20 or 1000 emphasise the effect of operation |
| Panel 3 | 1 or 5 repetitions emphasise the relationship between Panel 2
and Panel 3 representations 20 or 1000 emphasise the building up of the distribution |
Go/Pause/Play
To initiate an animation, choose a number of repetitions and click on the associated Go. When an animation begins, the label on the Go button changes to Pause. Press to pause the animation. The button label will then change to Play. Press to resume the running of the animation.Stop
This is a reset button at the top right of the window. It stops the animation completely and returns to the state following "Record my Choices"Jump to: Data mode - - Switching to Analysis mode - - Analysis mode - - Controlling the display - - File Menu - - Top
The File Menu
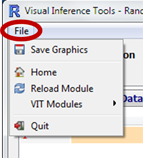
| Save graphics: | Save the contents of the graphics window as a file (bmp, jpg, pdf, png of TIFF) |
| Home: | Return to iNZightVIT Home screen |
| Reload Module: | Restart module clearing memory. Useful if VIT seems to have hung> |
| VIT Modules: | Select another VIT module |
| Quit: | Quit VIT and R> |