WeBIPP Tutorial - Population Pyramid
Video Tutorial (Coming Soon)
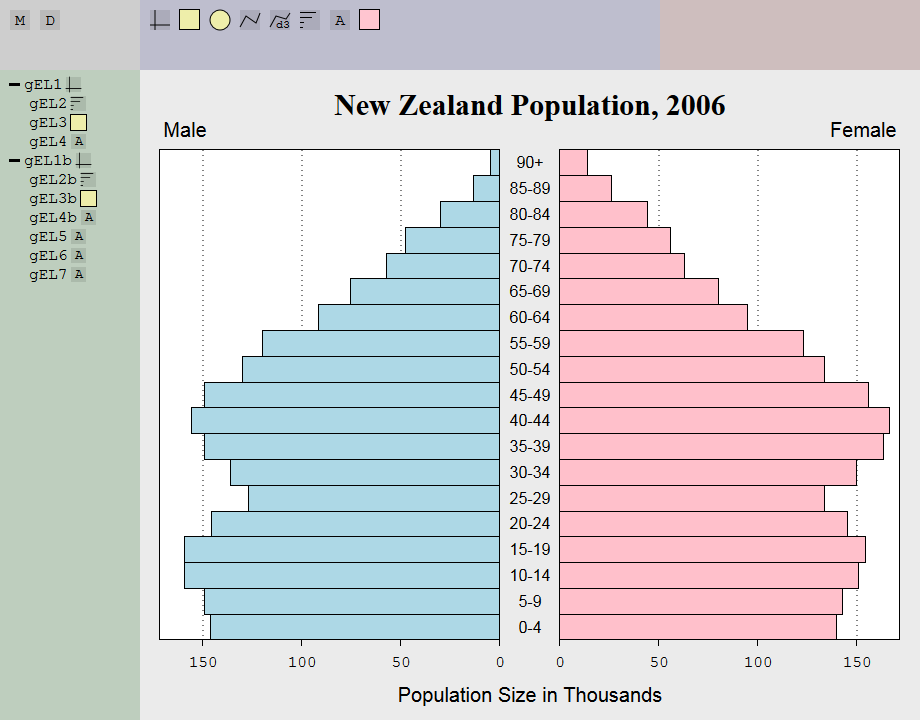
N.B. The following tutorial uses specific values that reproduce the same image shown above. These values are arbitrary and when creating such graphics from scratch, would arise naturally from tweaking the numbers ad hoc to get a graphic that pleases you.
- Download the data in JSON form: link
- Read in the data (Tutorial - Reading Data from JSON)
- Add a Marker called PopPyrMale Start (Tutorial - Functionise your Actions)
- Drop a Cartesian Frame into the Graphics Region
- Select the Cartesian Frame and assign the data Female to x, and AgeGroup to y
- Set x-name to blank, x-domain to
[0,170]and x-range to[1,0.01] - Set y-range to
[1,0] - Set axes to
[1]to only display the bottom (1) axis label, and set axes-opts to{"1":{"ticks":4}}so that axis 1 has 4 tick marks - Set dim to
[(wbip.getdim("gGraph")[0] - 100)/2,
490]
and set transform to[20,80]- note that the dim's x value is computed from the x dimension of gGraph (the Graphics Region), this isn't strictly necessary and numbers could have been manually chosen ad hoc visually - Drop a Line Segment onto the Cartesian Frame
- Select the Line Segment and assign [50, 100, 150] to x1 and x2, 0 to y1
- Set the useScale attribute of y2 to false, then set y2
to
expr:curDim[1](curDim is the dimensions of the frame that this object is in, hence curDim[1] is the height of the Cartesian Frame) - again, this could have been a fixed number, in fact we know what this number is since we assigned dim manually above (to 490) - Set stroke-dasharray to
1 4to make it a dotted line (1 pixel drawn, then 4 pixels of nothing drawn, recurring) - Drop a Rectangle onto the Cartesian Frame
- Select the Rectangle and assign 0 to x, AgeGroup to y and Male to width
- Set useScale for x to true and adj for x to 1 so that the rectangles start from the far right, and go to the left
- Set fill to lightblue
- Set the useScale attribute of height to false, then set height to expr:curDim[1]/19 (as there are 19 Age Groups)
- Drop a Text object onto the Cartesian Frame
- Select the Text object and assign 170 to x and -20 to y. Also set useScale for x to true
- Set text to Male, text-anchor to start and font-size to 20
- Add a Marker called PopPyrMale End
- Functionise the first half by using the markers
["PopPyrMale
Start","PopPyrMale End"]
, and turn x-range ([1,0.01]), transform ([20,80]), x-adj ("1"), dataset (Male), colour (lightblue) and label text alignment (start), into arguments. These are the things that need to be altered for the second half. - Use your newly created function, setting the arguments as follows:
x-range (
[0,0.99]), x-adj ("0"), transform ([(wbip.getdim("gGraph")[0] - 100)/2 + 80, 80]), dataset (Female), colour (pink) and label text alignment (end) - Drop a Text object onto the second (Female) Cartesian Frame - we use the second one as it makes it easier to align the text objects in the centre, between the two frames
- Select the Text object and assign -30 to x and AgeGroup to both y and text
- Drop another Text object onto the second (Female) Cartesian Frame
- Select the Text object and assign -30 to x and -45 to y
- Set text to New Zealand Population, 2006, font-size to 30, font-weight to bold and font-family to serif
- Drop another Text object onto the second (Female) Cartesian Frame
- Select the Text object and assign -30 to x and 545 to y
- Set text to Population Size in Thousands and font-size to 20
The following assume you have finished the integrated tutorial
Drawing the first half of the Pyramid
Drawing the dotted lines in the background
Drawing the rectangles
Adding the label
Functionising the first half
Adding additional labels
Your final code should look something like this
wbip.data["datnzpop_2006.json"] = JSON.parse("{\"AgeGroup\":[\"0-4\",\"5-9\",\"10-14\",\"15-19\",\"20-24\",\"25-29\",\"30-34\",\"35-39\",\"40-44\",\"45-49\",\"50-54\",\"55-59\",\"60-64\",\"65-69\",\"70-74\",\"75-79\",\"80-84\",\"85-89\",\"90+\"],\"Male\":[146.21,149.23,159.52,159.4,145.85,126.77,136.32,149.14,155.94,149.12,129.93,120.08,91.9,75.62,57.38,47.57,30.18,13.16,5.02],\"Female\":[139.79,142.65,150.92,154.16,145.33,133.6,149.7,163.43,166.54,156.04,133.72,122.93,94.76,79.91,62.79,56.03,44,25.92,14.04]}\r\n");
// MARKER PopPyrMale Start
wbip["frcart"].click("gEL1", d3.select("#gGraph"), [65,33]);
wbip["frcart"].setattr("gEL1", "x", "wbip.data[\"datnzpop_2006.json\"][\"Female\"]");
wbip["frcart"].setattr("gEL1", "x-name", "");
wbip["frcart"].setattr("gEL1", "x-domain", "[0,170]");
wbip["frcart"].setattr("gEL1", "x-range", "[1,0.01]");
wbip["frcart"].setattr("gEL1", "y", "wbip.data[\"datnzpop_2006.json\"][\"AgeGroup\"]");
wbip["frcart"].setattr("gEL1", "y-range", "[1,0]");
wbip["frcart"].setattr("gEL1", "axes", "[1]");
wbip["frcart"].setattr("gEL1", "axes-opts", "{\"1\":{\"ticks\":4}}");
wbip["frcart"].setattr("gEL1", "dim", "[(wbip.getdim(\"gGraph\")[0] - 100)/2, 490]");
wbip["frcart"].setattr("gEL1", "transform", "[20,80]");
wbip["line-segment"].click("gEL2", d3.select("#gEL1"), [239,97]);
wbip["line-segment"].setattr("gEL2", "x1", "[50, 100, 150]");
wbip["line-segment"].setattr("gEL2", "x2", "[50, 100, 150]");
wbip["line-segment"].setattr("gEL2", "y1", "0");
wbip["line-segment"].setattr("gEL2", "y2-useScale", "false");
wbip["line-segment"].setattr("gEL2", "y2", "expr:curDim[1]");
wbip["line-segment"].setattr("gEL2", "stroke-dasharray", "1 4");
wbip["rect"].click("gEL3", d3.select("#gEL1"), [118,62]);
wbip["rect"].setattr("gEL3", "x", "0");
wbip["rect"].setattr("gEL3", "x-useScale", "true");
wbip["rect"].setattr("gEL3", "x-adj", "1");
wbip["rect"].setattr("gEL3", "y", "wbip.data[\"datnzpop_2006.json\"][\"AgeGroup\"]");
wbip["rect"].setattr("gEL3", "width", "wbip.data[\"datnzpop_2006.json\"][\"Male\"]");
wbip["rect"].setattr("gEL3", "height-useScale", "false");
wbip["rect"].setattr("gEL3", "height", "expr:curDim[1]/19");
wbip["rect"].setattr("gEL3", "fill", "lightblue");
wbip["text"].click("gEL4", d3.select("#gEL1"), [181,34]);
wbip["text"].setattr("gEL4", "x", "170");
wbip["text"].setattr("gEL4", "x-useScale", "true");
wbip["text"].setattr("gEL4", "y", "-20");
wbip["text"].setattr("gEL4", "text", "Male");
wbip["text"].setattr("gEL4", "text-anchor", "start");
wbip["text"].setattr("gEL4", "font-size", "20");
// MARKER PopPyrMale End
wbip.fise.new("PopPyr", {"marker":["PopPyrMale Start","PopPyrMale End"]}, [{"match":"[1,0.01]","name":"x-range","type":"none"},{"match":"[20,80]","name":"transform","type":"none"},{"match":"\"1\"","name":"x-adj","type":"none"},{"match":"Male","name":"data","type":"none"},{"match":"lightblue","name":"colour","type":"none"},{"match":"start","name":"text-align","type":"none"}]);
wbip.vars.fise["PopPyr"]({"x-range":"[0, 0.99]","transform":"[(wbip.getdim(\\\"gGraph\\\")[0] - 100)/2 + 80, 80]","x-adj":"\"0\"","data":"Female","colour":"pink","text-align":"end"});
wbip["text"].click("gEL5", d3.select("#gEL1b"), [44.5,143]);
wbip["text"].setattr("gEL5", "x", "-30");
wbip["text"].setattr("gEL5", "y", "wbip.data[\"datnzpop_2006.json\"][\"AgeGroup\"]");
wbip["text"].setattr("gEL5", "text", "wbip.data[\"datnzpop_2006.json\"][\"AgeGroup\"]");
wbip["text"].click("gEL6", d3.select("#gEL1b"), [44.5,68]);
wbip["text"].setattr("gEL6", "x", "-30");
wbip["text"].setattr("gEL6", "y", "-45");
wbip["text"].setattr("gEL6", "text", "New Zealand Population, 2006");
wbip["text"].setattr("gEL6", "font-size", "30");
wbip["text"].setattr("gEL6", "font-weight", "bold");
wbip["text"].setattr("gEL6", "font-family", "serif");
wbip["text"].click("gEL7", d3.select("#gEL1b"), [84.5,446]);
wbip["text"].setattr("gEL7", "x", "-30");
wbip["text"].setattr("gEL7", "y", "545");
wbip["text"].setattr("gEL7", "text", "Population Size in Thousands");
wbip["text"].setattr("gEL7", "font-size", "20");