Russell B. Millar
Department of Statistics, University of Auckland, Private Bag 92019, Auckland, New Zealand
Introduction
Three alternative methodologies for estimating selection curves
for gill nets have recently appeared in the fisheries literature
(Hovgård 1996; Helser et al. 1998; Millar and Fryer 1999).
This comment shows that these three approaches have a common underlying
structure.
Identification of this common structure permits the differences between
the approaches to be clarified,
which in turn enables the relative merits of these methodologies to
be compared using well known statistical results.
The methodologies considered here are for indirect estimation of gillnet selection curves. Typically, gill nets of varying mesh sizes are fished simultaneously with equal effort and in such a manner as to avoid unnecessary biases in the catch. The data are the catches of differing size classes of fish in the various gill nets. In contrast, direct estimation is possible if the size distribution of the population (or a tagged sub-population) being fished is known. Direct methods are not considered here.
The analysis of data from indirect gillnet selectivity studies has a
rather confusing history of competing methodologies and assumptions,
which is partly due to the often inadequate specification of ``selectivity''.
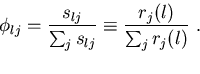
Here, the selection curve is denoted r(l) and is defined to be
the relative probability that a fish of length l is captured given
that it contacts the gear.
To distinguish between the varying mesh sizes, rj(l), will be used to
denote the selection curve for the ![]() mesh size.
mesh size.
To keep things simple, this discussion will avoid consideration of length dependent avoidance behaviour and availability, and the comparison of methodologies will be made for the case when all mesh sizes are fished with equal effort and have equal fishing power. These issues are extremely relevant to gillnet selectivity studies, and are discussed in Millar and Fryer (1999) where the notions of contact-selection, available-selection, population-selection and fishing intensity are developed. The selection curve, r(l), defined above is a (relative) contact-selection curve (i.e., a retention curve) and Millar and Fryer (1999) explain that r(l) can be assumed to have a maximum height of unity without loss of generality. It is not possible to estimate available-selection or population-selection curves from indirect gillnet studies without additional information.
Note that the above definition uses length as the measure of fish size.
It is likely that girth would be a more relevant measure of size for
the purposes of estimating gillnet selectivity, and this methodology
applies equally well if length is replaced by girth.
In practice it is usually length that is measured, and this is assumed here.
Henceforth, l, will be used to denote the length class having length l
as its midpoint.
For example, the 30 cm length class might be all fish with length between
29.5 and 30.5 cm.
What say the data?
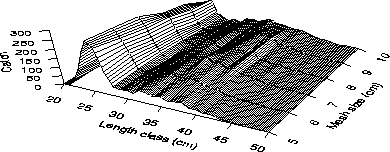
The data can be viewed in their entirety using a 3-dimensional plot.
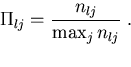
If nlj is the number of length-class l fish caught in mesh j
then this 3-D plot is given by plotting nlj on the vertical axis
and length class, l, and mesh size, mj, on the horizontal axes (Fig 1).
It has long been recognized that selection curves can not be naively obtained from this 3-D plot because the catches depend critically on the abundance of each length class (Regier and Robson 1966; Hamley 1975). The dominant feature in Figure 1 is the relatively high catches of fish around 25 cm in length. The abundance of these sizes in all meshes is strong evidence that they are predominant in the population.
Within each length class the distribution of the catch amongst the meshes of varying size is due solely to differences in the operational performance of the meshes. Hence, many methodologies for estimating gillnet selection curves have been based on explicit modeling of the data (or scaled data) within each length class. This has led to the introduction of the so-called Type A and Type B curves (Regier and Robson 1966). These curves are not precisely defined in the literature and consequently the descriptions given below are somewhat vague.
The methods
The methodology of Helser et al. (1991) follows the first Type A
curve approach and obtains selection curves from scaling Type B curves fitted
to the catch data.
Helser et al. (1998) voice concerns with this approach, saying
``Problems still remain with using type B curves as intermediaries because
existing methods either involve some degree of subjectivity in fitting the
data or the statistical properties of the selectivity estimates and
estimation methodology to derive final type A curves are unknown.''
Helser et al. (1998) then advocate use of the second Type A approach,
whereby the selection curve is now obtained directly from fitting Type B
curves to scaled data.
This approach enables the fitting of the Type B curves to be done
simultaneously for all length classes,
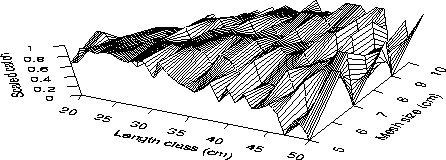
and can be viewed as fitting a response surface to the 3-D plot of scaled
data (Fig. 2).
In the context of gillnet selectivity, the methodology of Millar and Fryer (1999) has origins dating back to Kirkwood and Walker (1986) and Wulff (1986). This methodology does a simultaneous fit to the catch data using maximum likelihood, and is now commonly known as the SELECT method (Millar 1992). That is, it fits a response surface directly to the catch data (Fig. 1). The approach of Hovgård (1996) is similar, except that it fits the response surface using least squares instead of maximum likelihood.
By performing a simultaneous fit,
Helser et al. (1998) have moved closer toward the
SELECT (Millar 1992) and Hovgård (1996) methods.
However, it is shown below that the use of scaled data (Fig. 2)
rather than catch data (Fig. 1)
results in substantial difference in the properties of these methodologies.
Simultaneous fitting
Fitting response surfaces to scaled data
Prior to fitting,
the Helser et al. (1998) method implements the Type B fit by first
scaling the data within each length class.
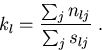
They use
 |
(1) |
Helser et al. (1998) use least squares to model the ![]() values
by minimizing
values
by minimizing
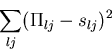
Helser et al. (1998) considered skew-normal Type B curves having up
to 6 parameters.
After comparing a variety of fits to their spotted seatrout data
they concluded that the preferred form of the Type B curve was
the simpler normal-shaped curve specified by 4 parameters.
This was
![\begin{displaymath}
s_{lj} = \exp \left( \frac{-(m_j-[a+bl])^2}{2[c+dl]^2} \right) . \vspace*{0.25cm}\end{displaymath}](img5.gif) |
(2) |
The estimated selection curve, rj(l), for mesh size j is then the
Type A curve arising from equation (2).
That is, from fixing j and regarding (2) as a function of l.
For the data of Helser et al. (1998) this curve is seen to be of
similar shape to the normal, but with some skewness to the right.
Fitting response surfaces to observed data
With the simplifying assumptions that meshes are fished with equal effort
and have the same fishing power,
the definition of rj(l) results in the fact
(Feller 1968; Millar and Fryer 1999) that,
| |
(3) |
The difference between SELECT and Hovgård (1996) is the manner
in which the fit is obtained.
SELECT does this using maximum likelihood under the assumption that
the catches are from a (possibly overdispersed) Poisson distribution.
Hovgård (1996) uses least squares, minimizing
 |
(4) |
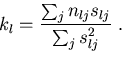 |
(5) |
 |
(6) |
Comparison
The properties of the data (Figs 1 and 2) underly the differences in the methodologies and their relative performance.
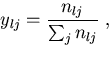
Properties of the data
The observed catches (Fig. 1) are count data and hence the statistical nature of these data is reasonably well known. In particular, the expected value of the observed catch is given by equation (3). In additon, the variance of count data increases as its expected value increases. If fish behaviour satisfies certain assumptions then the counts will be Poisson distributed and the variance of the counts is then equal to the expected value. More generally, the Poisson assumption will be untenable (because of schooling behaviour, say) and it is better to simply assume that the variance of the counts is proportional to their expected values.
Little can be said about the statistical nature of the scaled data, ![]() .It should be noted that the expected value of
.It should be noted that the expected value of ![]() is not slj.
To see this, note that for sufficiently large (or small) fish the
value of slj will be small for all mesh sizes used because
none of the mesh sizes will be ``optimal'' for catching such sizes of fish.
However, for every length class the scaling used in equation (1)
produces a
is not slj.
To see this, note that for sufficiently large (or small) fish the
value of slj will be small for all mesh sizes used because
none of the mesh sizes will be ``optimal'' for catching such sizes of fish.
However, for every length class the scaling used in equation (1)
produces a ![]() value of unity for at least one mesh size.
In addition, the variance of
value of unity for at least one mesh size.
In addition, the variance of ![]() depends on
the number of fish caught in the length class because
if the catches of length-class l are high then
depends on
the number of fish caught in the length class because
if the catches of length-class l are high then ![]() will
have little variability, but conversely, if the catches are low then
will
have little variability, but conversely, if the catches are low then
![]() will be extremely variable and unreliable.
However, the information about number of fish caught (i.e., sample size)
is lost when the
will be extremely variable and unreliable.
However, the information about number of fish caught (i.e., sample size)
is lost when the ![]() are calculated.
It is also the case that the
are calculated.
It is also the case that the ![]() are not independent within each
length class.
This is because they share the same divisor,
are not independent within each
length class.
This is because they share the same divisor, ![]() , in equation
(1).
, in equation
(1).
Model selection and inference
The SELECT method utilizes the known properties of maximum likelihood. In particular it makes use of likelihood ratio tests for model selection, and obtains an approximate covariance matrix for the estimated parameters from the second derivative matrix of the log-likelihood. When the catch data are Poisson distributed then the estimators are known to be approximately unbiased, and they are known to be the best estimators possible in terms of having minimum variance. If the Poisson assumption is violated because the data have variance proportional to the expected value (rather than equal to), then SELECT retains these properties, and can be viewed as quasi-likelihood (Millar and Fryer (1999)).
The least squares fit implemented by Hovgård (1996) should give reasonable parameter estimates. In particular, the terms in the sums-of-squares formula (4) are the difference between the catches and their expected values, and minimization of (4) therefore corresponds to using an unbiased estimating function (McLeish and Small 1998). This implies that the estimated parameters will be approximately unbiased (McLeish and Small 1998). However, the validity of model selection and inference requires the variance of the data (Fig. 1) to be used in the fitting procedure. This is not the case with this method, and hence the legitimacy of the selected models and inferences can not be substantiated. It should be noted that the method of Hovgård (1996) could be improved by using weighted least squares to incorporate these variances, and if used in this way it can be viewed as an approximation to maximum likelihood (McCullagh and Nelder 1989).
The least squares fit of Helser et al. (1998) corresponds to a
biased estimating function because the expected value of ![]() is
not slj.
Hence the estimated parameters are prone to bias.
The bias in
is
not slj.
Hence the estimated parameters are prone to bias.
The bias in ![]() is particularly pronounced for the extreme
length classes and hence discarding these data
(e.g., Helser et al. (1998), p. 1331) may reduce the degree of bias.
The preferred form of slj is chosen using
the nonlinear least-squares output for model selection.
This output also provides approximate analytical estimates
of parameter variance.
In addition, Helser et al. (1998) obtain estimates of parameter variance
and bias by bootstrapping via resampling of the fitted residuals
(Davison and Hinkley, p. 261).
They conclude that their methodology has good statistical properties because
the analytical estimates of variance are similar to the bootstrap estimates.
However, the version of the bootstrap used here is known to be unable to
detect model violation (e.g., Davison and Hinkley 1997, p. 264) and hence it
is perhaps to be expected that the least squares and bootstrap esimates
of variance will always be similar.
is particularly pronounced for the extreme
length classes and hence discarding these data
(e.g., Helser et al. (1998), p. 1331) may reduce the degree of bias.
The preferred form of slj is chosen using
the nonlinear least-squares output for model selection.
This output also provides approximate analytical estimates
of parameter variance.
In addition, Helser et al. (1998) obtain estimates of parameter variance
and bias by bootstrapping via resampling of the fitted residuals
(Davison and Hinkley, p. 261).
They conclude that their methodology has good statistical properties because
the analytical estimates of variance are similar to the bootstrap estimates.
However, the version of the bootstrap used here is known to be unable to
detect model violation (e.g., Davison and Hinkley 1997, p. 264) and hence it
is perhaps to be expected that the least squares and bootstrap esimates
of variance will always be similar.
Implementation
For many commonly used forms of the selection curve, SELECT can be fitted using software for the fitting of generalized linear models (McCullagh and Nelder 1989). Indeed, Millar and Holst (1997) show how SELECT fits of normal, gamma, or lognormal shaped selection curves can be fitted using just three lines of code in Splus or SAS.
In the general case,
all three methodologies can be fitted using the general purpose
optimization software available in most mathematical and statistical
packages.
The Hovgård (1996) and Helser et al. (1998) fits can be achieved using
software dedicated to implementing nonlinear least squares and such
software may be more familiar and easier to use than a
general purpose optimizer.
Generality
A useful methodology for estimation of gillnet selectivity must be able to address the many challenging questions associated with gear selectivity. These include considerations of geometric similarity, bimodal selection curves, variable fishing power, sampling of catches and between-set variation.
The simple formulation in (3) is easily extended to permit consideration of all of these issues and one is then faced with an exercise in model selection. For SELECT, this is discussed in Millar and Fryer (1999). The unweighted least-squares approach of Hovgård (1996) may be inadequate for this purpose because it ignores the heterogeneous variability in the catch data.
Some of these issues could be extremely problematic to the Helser et al. (1998) methodology. For example, sampling of the catches is in principle a question of sample size, but the scaled data (Fig. 2) contain no explicit information about sample size. Between-set variation induces correlation between the scaled data across differing mesh sizes, but it is not clear how this would be incorporated into the nonlinear least squares procedure or the resampled-residuals bootstrap. Variable fishing power of the mesh sizes will result in very nonstandard forms for the Type B curve and it is not clear how these would be specified.
Bayesian methodology is beginning to compete with
classical statistical methodology in an ever
increasing number of quantitative fisheries applications.
The Bayesian methodology utilizes prior information and a model-induced
likelihood function.
Therefore, since the Hovgård (1996) and Helser et al. (1998) methods
do not use likelihood,
only SELECT can formally be extended to Bayesian modeling of size selectivity.
Estimation of population length distribution
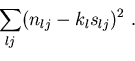
It is extremely pertinent to bear in mind that estimation of gillnet selectivity is frequently not the primary research question. Rather, the objective is often to estimate the length distribution of fish in the population, and estimation of selectivity is therefore just an intermediary step. That is, we wish to estimate the quantities kl in equation (3).
Once the overall selectivity of the the entire ``gang'' of gill nets
(the set of gill nets deployed) is estimated,
the length distribution is estimated by dividing the catch of each
length class by the estimated overall selectivity for that length class.
Note that this is given by equation (6).
That is, estimation of the population length distribution is
an intrinsic part of modeling with SELECT.
This consistency of methodology does not extend to the Hovgård (1996)
or Helser et al. (1998) approaches.
Indeed, the Hovgård approach uses equation (5) to
fit the selection curve, and then changes to equation (6)
to estimate the population length distribution.
Another look at Type B curves
It may appear that the SELECT and Hovgård (1996) methods do not make use of Type B curves. In fact, they do. Indeed, the terminology ``SELECT'' arose as the acronyn of Share Each LEngth-class's Catch Total (Millar 1992), which is an instruction to model within each length class, that is, to fit Type B curves.
Millar (1992) showed that the maximum likelihood fit of expected catches
to observed catches is equivalent to fitting Type B curves to the proportion of
catch within each length class,
 |
(7) |
 |
(8) |
It should be noted that SELECT does not utilize direct specification of
the Type B curves,
but rather, obtains them from formula (8).
Note that the functional form of ![]() is obtained by consideration of
the functional form and properties (e.g. unimodality, geometric similarity)
of the selection curves, rj(l),
and more generally from consideration of relative fishing power,
sampling effort, etc.
is obtained by consideration of
the functional form and properties (e.g. unimodality, geometric similarity)
of the selection curves, rj(l),
and more generally from consideration of relative fishing power,
sampling effort, etc.
Conclusions
The SELECT and Hovgård (1996) methods directly model the processes which influence the expected catch data. Thus, in addition to selectivity, they can also model any possible dependence of the catch data on processes such as variable fishing power and between-set variability, and any assumptions (e.g., geometric similarity) are transparent.
The SELECT and Hovgård (1996) methods differ in the way in which they implement the fit of the model to the catch data, with SELECT using maximum likelihood and Hovgård (1996) using nonlinear least squares. Maximum likelihood estimation is known to have desirable statistical properties under general conditions. Nonlinear least squares should also give reasonable parameter estimates, but is likely to be inadequate for the purpose of model selection and inference because the fit does not take the variance structure of the data into account.
The SELECT method provides a cohesive approach to selectivity analysis. For example, estimates of the population length distribution (equation (6)) are a by-product of the maximum likelihood fit. Moreover, SELECT is consistent with selectivity analyses performed for other gear types. In particular, logistic regression is the default technique for estimating the selection curve of a trawl from a covered-codend study (Wileman et al. 1996), and it is a special case of the SELECT methodology.
The Helser et al. (1998) method has several properties which are cause for concern, including bias of parameter estimators (arising from the fitted values not being the expected values of the scaled catch data), and heterogeneous variance and correlation in the scaled data. In addition, this method can be expected to give estimators with higher variability than the other methodologies, because of its need to discard data. Note that this need to eliminate data from some length classes is due solely to the methodology, and it could be that legitimate and informative data are being overlooked. The resampled-residuals bootstrap is not capable of indicating these difficulties. A bootstrap which resamples from the catch data is required and could be implemented as either a parametric bootstrap (a simulation using the fitted parameter values) or as a nonparametric bootstrap which resamples the actual catch data.
Helser et al. (1998) feel that their approach provides a general methodology
for estimation of gillnet selectivity.
The concerns raised here show that this can not be substantiated
on theoretical grounds, and an extensive simulation study would be in order.
The methodology would also need to be expanded to allow for the effects
of differing fishing intensity of the meshes, between-set variation and
sampling of catches.
Acknowledgments
I thank Jamie Gibson
(Dept of Biology, Dalhousie University, Halifax, Nova Scotia)
for discussions which
motivated this work and for his comments on the first draft,
and René Holst (Constat, North Sea Centre, Hirtshals, Denmark) for
comments on the second draft.
References
Figures
Fig. 1: Catch data